What is Graylog? A Powerful Tool for Collecting, Indexing, and Analyzing Log Data
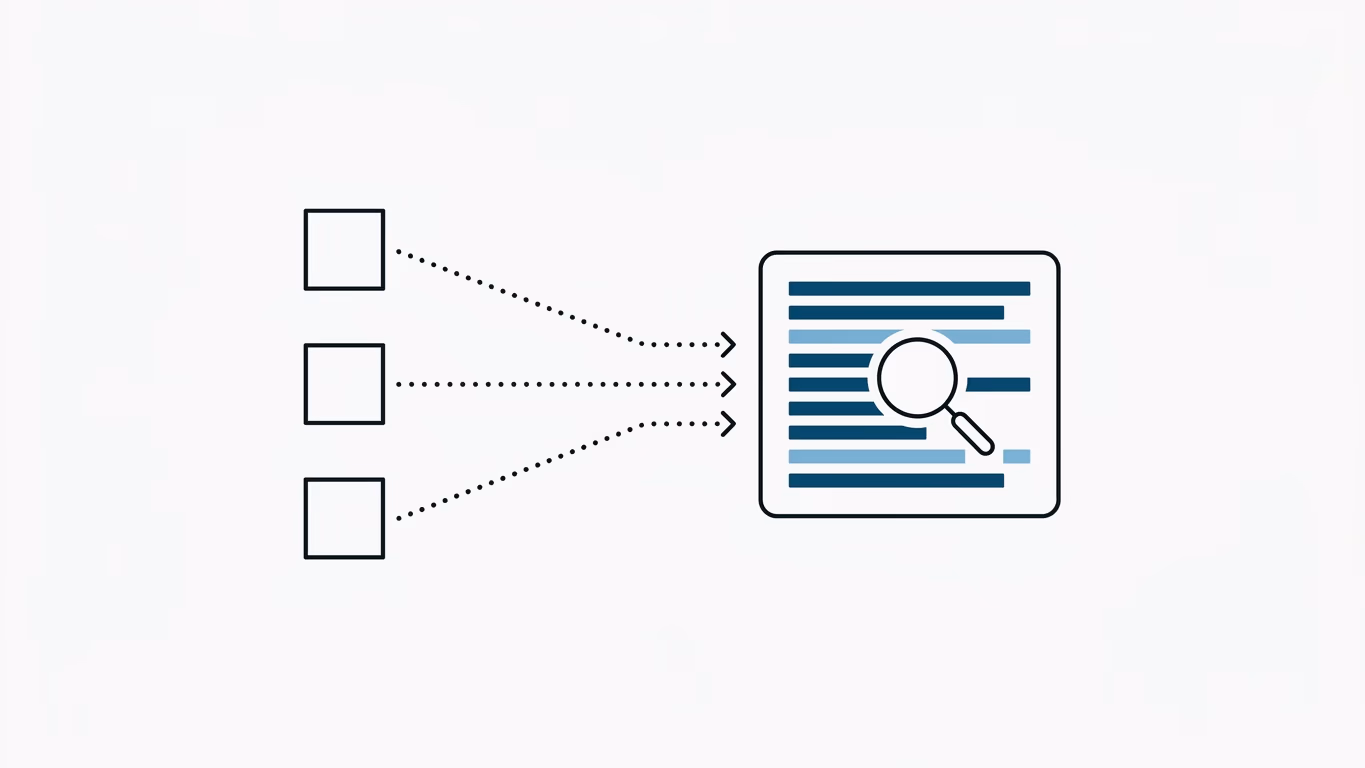
In modern distributed software architectures, troubleshooting issues across multiple servers, microservices, and databases can be a nightmare without central log aggregation. This is where Graylog comes in.
💡 TL;DR (Quick Summary):
- What is Graylog? An open-source log management platform designed to collect, index, parse, and analyze massive volumes of structured and unstructured log data in real-time.
- Under the Hood: It relies on MongoDB (for storing configuration metadata) and OpenSearch (or Elasticsearch, for storing and indexing the actual log messages).
- When to Use: Ideal for centralized logging, security monitoring (SIEM/compliance), application troubleshooting, and generating alerts when specific thresholds are breached.
Why Centralized Logging is Necessary
If you are running a monolithic application on a single server, tailing local log files (tail -f /var/log/nginx/access.log) might be sufficient. However, as soon as you transition to a multi-node cluster, containerized environments (like Docker/Kubernetes), or microservices, searching logs individually becomes impossible.
Centralized logging solutions collect logs from all instances, parse them into structured formats (like JSON or GELF), index them, and expose them through a unified dashboard.
Modern Graylog Architecture (Docker Compose)
Graylog 5.x+ has shifted towards OpenSearch as its primary search and indexing engine, alongside traditional Elasticsearch (7.10.x).
Below is a production-ready, local-development-friendly docker-compose.yml file to get Graylog up and running with MongoDB 5.0 and OpenSearch 2.x.
version: '3.8'

services:
  mongodb:
    image: mongo:5.0
    container_name: graylog-mongodb
    volumes:
      - mongodb_data:/data/db

  opensearch:
    image: opensearchproject/opensearch:2.11.0
    container_name: graylog-opensearch
    environment:
      - OPENSEARCH_JAVA_OPTS=-Xms1g -Xmx1g
      - bootstrap.memory_lock=true
      - discovery.type=single-node
      - plugins.security.disabled=true
    ulimits:
      memlock:
        soft: -1
        hard: -1
      nofile:
        soft: 65536
        hard: 65536
    volumes:
      - opensearch_data:/usr/share/opensearch/data

  graylog:
    image: graylog/graylog:5.2
    container_name: graylog-server
    environment:
      # Generate a 96+ character random secret using: pwgen -N 1 -s 96
      - GRAYLOG_PASSWORD_SECRET=some_very_long_password_secret_at_least_96_characters_long
      # SHA-256 hash of your admin password (default 'admin' hash below)
      - GRAYLOG_ROOT_PASSWORD_SHA2=8c6976e5b5410415bde908bd4dee15dfb167a9c873fc4bb8a81f6f2ab448a918
      - GRAYLOG_HTTP_BIND_ADDRESS=0.0.0.0:9000
      - GRAYLOG_ELASTICSEARCH_HOSTS=http://opensearch:9200
      - GRAYLOG_MONGODB_URI=mongodb://mongodb:27017/graylog
    ports:
      # Web Interface & REST API
      - "9000:9000"
      # GELF UDP Input
      - "12201:12201/udp"
      # Syslog UDP Input
      - "1514:1514/udp"
    volumes:
      - graylog_data:/usr/share/graylog/data
    depends_on:
      - mongodb
      - opensearch

volumes:
  mongodb_data:
  opensearch_data:
  graylog_data:
Starting the Stack
Ensure you have increased your system's vm.max_map_count (required for OpenSearch/Elasticsearch to run):
sudo sysctl -w vm.max_map_count=262144
docker-compose up -d
You can access the web console at http://localhost:9000 using the username admin and password admin.
Log Analytics Tool Comparison
| Metric | Graylog | ELK Stack (Elasticsearch, Logstash, Kibana) | Grafana Loki |
|---|---|---|---|
| Primary Focus | Out-of-the-box log management & alerting | General-purpose data search & visualization | Lightweight, cost-effective Prometheus-like logging |
| Parsing & Pipelines | Native GUI-driven inputs, streams, and pipelines | Complex Logstash pipelines (requires config files) | Promtail/Logql pipeline stages |
| Storage Cost | High (indexes all fields) | High (indexes all fields) | Low (indexes metadata labels only) |
| Alerting | Built-in native GUI alerting | Requires elastalert or Kibana gold/platinum license | Grafana alerts |
Frequently Asked Questions (FAQ)
What is GELF (Graylog Extended Log Format)?
GELF is an open, JSON-based log format developed by Graylog to overcome the limitations of classic Syslog. It supports compressed payloads, structured key-value metadata, and prevents packet truncation by splitting messages.
Can I run Graylog on a low-resource server?
OpenSearch/Elasticsearch are memory-heavy. We recommend a minimum of 4GB RAM for development, and 8GB+ RAM for stable production environments. For very lightweight systems, look into Grafana Loki instead.
What is the difference between Streams and Pipelines?
- Streams are used to route logs in real-time to specific folders or user groups based on simple rules (e.g., separating Nginx access logs from Laravel error logs).
- Pipelines are processing chains where you can write custom rules to modify, format, redact (e.g., hiding credit card numbers), or enrich (e.g., GeoIP lookup) log data before indexing.
Official Links and Documentation
Changelog
- 2026-06-20: Modernized article with Graylog 5.x + OpenSearch 2.x Docker Compose configuration, comparison table, LLO formatting, and Turkish translation.